We take you through the most important reports from Google Analytics and Google Search Console.
If you’re planning to spend your time, effort and money on search engine optimisation, it’s essential that you have suitable tools to measure your progress and determine your return on investment.
Thankfully, Google themselves provide world-class software to track your web traffic, including that coming from organic search. These tools happen to be free for anyone to use, though the very largest enterprise users can opt for premium versions, which offer additional features and can handle data for higher traffic volumes.
The first essential tool, Google Analytics, captures data on your website’s traffic, including where it came from, what the users did on your website and how well the traffic converted into registrations, sales or many other types of transaction.
The second tool, Google Search Console, works in unison with Google Analytics. Whereas Google Analytics tells you what happened on your website, Google Search Console tells you how your website is performing in Google’s search index. This is very useful when trying to develop campaigns to improve your site’s SEO performance.
Getting Started With GA & GSC
Google Analytics, can be easily installed on your website by either embedding a tracking code in the header or footer of your web pages, but typically this is added to your theme file, which loads on every page of your website. You may also use built-in settings or plugins which are available for popular web platforms such as WordPress, Shopify or Magento.
Google provides detailed instructions on how to install Analytics here.
Setting up Google Search Console involves proving to Google that you are the rightful owner of your domain before they can release information about your site’s performance from their index.
Google provides a guide to getting started with Google Search console here.
There are many guides on the web that can help to ensure that you are running an optimal implementation of Google Analytics for your chosen platform. Here are guides for setting up Google Analytics on:
Using Google Analytics Effectively
In our experience, there are a few pitfalls that marketers can sometimes face with Google Analytics (GA) that can be easily avoided. An incorrect installation or configuration of GA will provide erroneous data and potentially incorrect insights. This could in turn result in adopting the wrong strategy for your SEO which may impact your search performance.
Although almost all popular platforms now include easy integration of GA’s tracking code through their settings or plugins, it’s still worth digging into your GA configuration at the earliest opportunity so that you can ensure that the data you’re capturing is as accurate as possible from the outset. You don’t want to find out that your data collection has been inaccurate 6 months in!
For example, it’s worth creating a second “view” in GA that filters out bot traffic and referral spam.
Common Mistakes When Using Google Analytics
In this section, we’ll explore some of the most common mistakes that we come across when it comes to using Google Analytics.
Not Testing Your Google Analytics Integration
One common mistake is not testing your Google Analytics integration.
There are plugins for Google Chrome such as Google’s Tag Manager Assistant and their Google Analytics Debug tool which can help you to ensure that your Analytics code is firing correctly across all of your webpages. The Realtime report in Google Analytics itself can be useful in ensuring that user activity is indeed being noted by Google Analytics. If you’re navigating through your website, but there’s no activity in the Realtime report (allowing for a few second long delay), it’s a good sign that your Google Analytics script is not firing correctly.

Not Firing the Google Analytics Script on Every Page
All of the most popular CMS/eCommerce platforms have built-in tools or plugins that make installing Google Analytics a simple task. That said, it’s still important to ensure that your Google Analytics code is firing on every page for which you would like to collect data.
For example, you may have a product category page on an eCommerce site which shows 10 products. When a user clicks “show more”, another 10 products are displayed. In most scenarios, that click will not trigger the Google Analytics script, while a “page 2” link to the additional products would have done so.
It’s important to understand when and how your script is triggered, so that you can be sure that you’re capturing data on all of the activity that matters to your business.
Not Setting Up Filters
One of the most common Google Analytics mistakes is not setting up filters. As well as making your data easier to manage, GA filters can be used to keep your data clean and accurate.
We recommend creating a second View for your Google Analytics property and applying filters to that. This means you will still have the original view which contains all of your unfiltered raw data, should you ever require it. Google’s guide to setting up a second view can be found here.

In your new view, create filters to exclude sessions from internal IPs, prepending hostname to Request URI and remove query strings.
Not Setting Up Cross-Domain Tracking
If your web presence exists over more than one domain (for example, blog.example.com and shop.example.com), you don’t need to use two separate GA accounts, nor should you mix the data from the two domains. In this scenario, you’re better off creating two separate Views for each individual sub-domain within the same Google Analytics Property: this is known as Cross-Domain Tracking.
Not Setting Up Goals
Goals are one of the most powerful functions of Google Analytics for digital marketers, but they require additional setup which is sometimes overlooked.
When you set up Goals in Google Analytics, you tell the software which website activity you’d consider a successful transaction, be it an online sale, a particular page load or a newsletter signup.
Goals can be set up at Conversion > Goals. The easiest goals to set up can be created by defining a web destination (such as a “transaction complete” or “thank you” page) associated with your desired user activity.

Once these goals have been configured, you’ll be able to see what percentage of your users complete these goals (or “convert”), which channels convert the best, which referral sources are driving conversions and which web pages generate the most conversions.

This is essential data for understanding where to focus your marketing efforts.
Deriving Insights From Too Little Data
If you’ve just launched your new website and are investigating the traffic data in GA for the first time, it’s tempting to implement changes based on this new found knowledge right away. However, it’s important to make sure that your observations are statistically significant before drawing insights and taking action based on them.
Make sure that you’ve allowed time to capture data on a significant volume of traffic before you make optimisations. Exactly how much traffic depends on the scale of your business.
Obsessively Digging Into Data Without Purpose
Now that you have all of this data at your fingertips, naturally you will want to spend time pouring over it, looking for insights that will push your business forward.
While it’s certainly a great idea to familiarise yourself with the various metrics available in GA and the comparisons and analysis that can be run, ensure that it’s done with a business purpose in mind. There’s little value in having a detailed understanding of your engagement metrics across segments if you are not yet driving significant traffic to your website.
Make the Most of Annotations
Google Analytics allows you to add annotations to many of the charts and datasets in your View. Perhaps a server error caused your site to be offline for a day, resulting in no traffic recorded in GA. You should annotate this datapoint with an explanation, so that when you look back in 6 months time, you understand why the traffic volumes are unusually poor that month.
Another example could be that your business was mentioned in print media. This may have generated a massive spike in direct traffic, without any indication as to what has caused it. By adding an annotation explaining the print media feature, the spike in traffic will make a lot more sense to other team members or in the future.
Whether you’ve launched a site or brand redesign, a new product, a special offer or a new marketing campaign, there are many examples of when you might want to add annotations to your data so that more useful insights can be derived.
You can do this by heading over to Acquisition > All Traffic > Channels and then clicking on “Create new annotation” under the graph.

Forgetting to Connect Google Search Console Within Google Analytics
It’s relatively simple to connect your Google Analytics and Google Search Console accounts. Navigate to Acquisition > Search Console and verify your account to be able to view some key GSC metrics within GA.

Mistaking Google Analytics Data For Exact Measurements
Increasingly, users are installing ad-blocking technologies that also stop Google Analytics from capturing their session data. Privacy focused browsers such as Brave and browsers created by rival businesses (such as Apple’s Safari) also limit the data that Google can collect on your website’s users.
All websites also receive traffic from bots and spammers, which can significantly skew your data, especially if you’re just starting to grow your traffic.
Furthermore, for high-traffic sites, Google uses data sampling to provide statistics, meaning that you shouldn’t consider traffic figures to be 100% exact. It is in fact an accurate estimation based on a randomly selected subset of your website users.
With these factors and others in mind, it’s worth taking Google Analytics data with a grain of salt. Although it’s an incredibly powerful tool and certainly the industry standard by far, it’s important to understand how the data was collected, how accurate it is and how far you should trust it when drawing insights and making decisions about your business.
Sharing Your Google Analytics Master Accounts
Depending on the size of your organisation, you may have various employees and external partners such as agencies who require access to your Google Analytics data. Often, people will share one “master” password with all of these individuals. There are many disadvantages to this, including the obvious password security issues, the inability to see who has made what changes to the account and the inability to allow different levels of access to each user.
By using the admin panel to provide specific access levels to individual accounts, you can avoid unintentional mishaps and ensure that you’re able to revoke access to any one user in particular without causing every user to have to update their password. It’s just good practice!
Analysing Your Website’s Organic Performance In Google Analytics
Now that you’re up and running with Google Analytics, you can begin to use the data collected as the foundation for your search engine optimisation efforts.
Viewing Your Organic Traffic
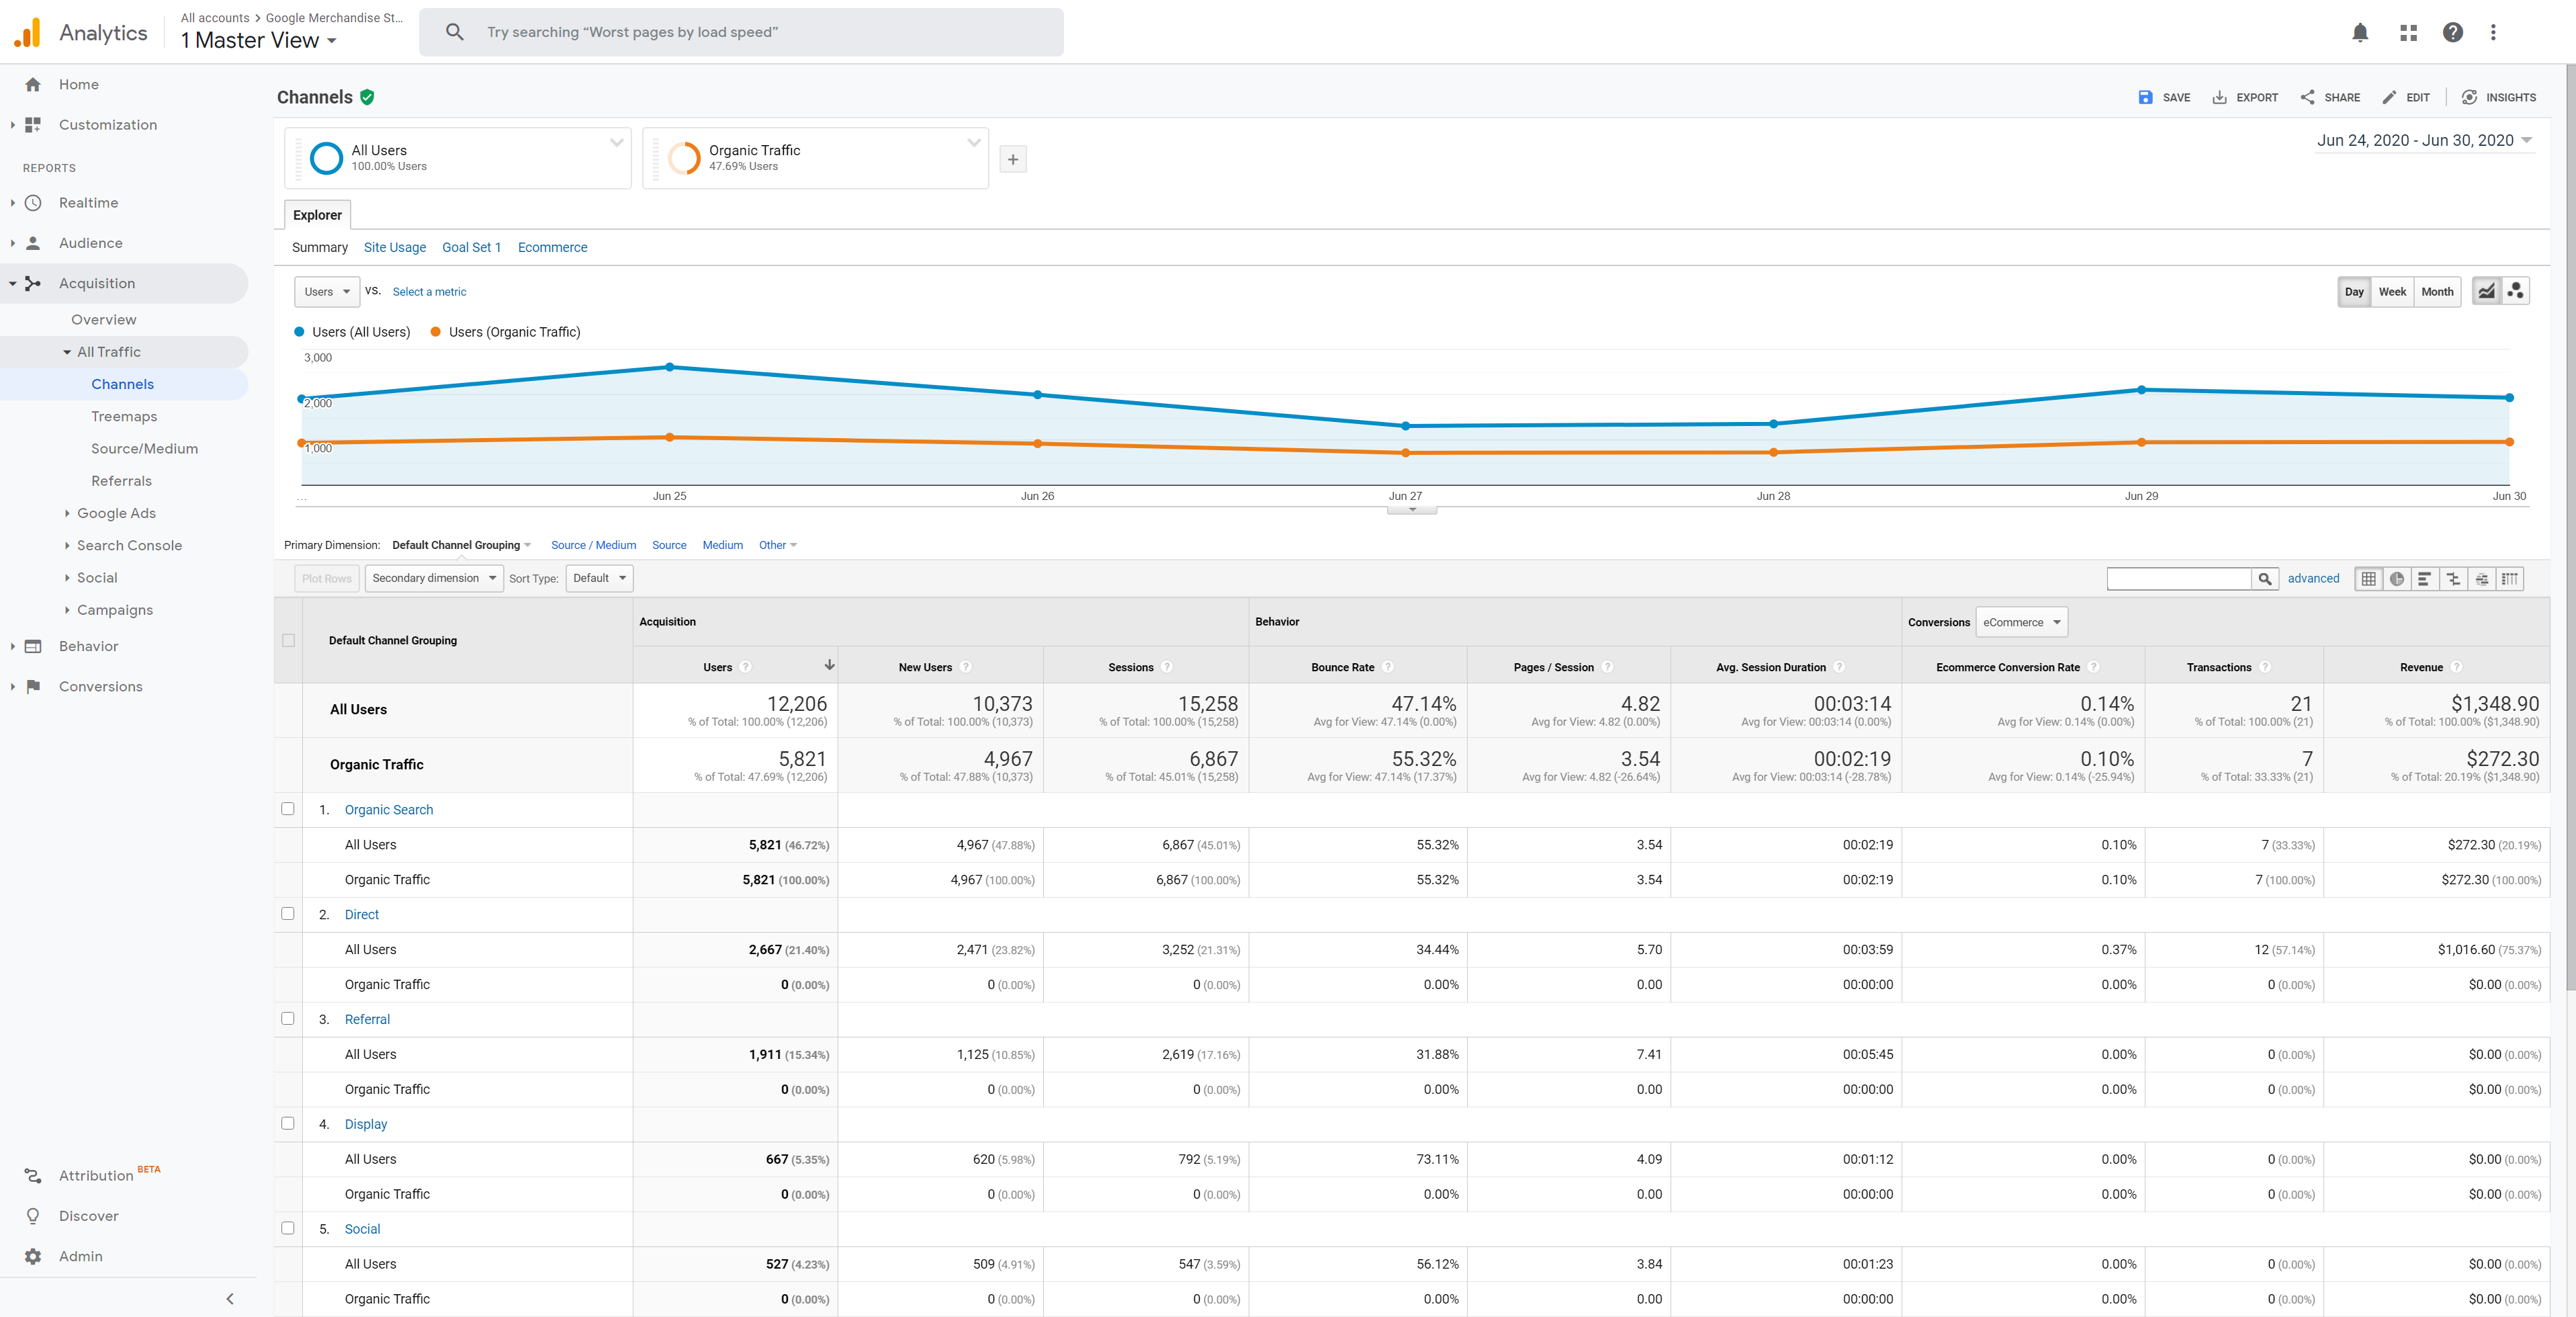
By clicking through to the Acquisition Report on the left-hand menu, then then clicking All Traffic > Channels, you will be presented with a chart showing the channels through which your traffic has arrived at your website.

By clicking on the Organic Search entry of the chart, you will be able to deep dive into a detailed report that refers only to organic traffic to your site.
This is one of the most powerful reports that GA offers to SEO-focused marketers, and allows you to find out which keywords are driving the most search traffic, which are bouncing, which are converting and much more besides.

We also recommend looking closely at your Landing Pages report (found at Behaviour > Site Content > Landing Pages). Here you’ll find data on which pages of your site your users or customers first arrive on when they come to your site. This can be useful, especially when people are arriving at your site on a page other than your homepage. Perhaps a certain page is converting well for users who land on it, and should therefore become the focus of your SEO efforts. Similarly, perhaps very few customers are discovering an important offer page, suggesting this page needs some SEO attention.

Measuring the Quality of Your SEO Traffic
By looking at the conversion rate for organic traffic in comparison to traffic from other channels (and in comparison to previous time periods), you can gain a sense of the quality of the traffic you’re getting as well as how it’s trending over time. Searching online can help you find conversion rate benchmarks for your specific industry.
If you find that your conversion rate is significantly lower than those benchmarks, it could be because the keywords you’re targeting do not represent buying intent. For example, “BMW won’t start” is not going to convert anywhere near as highly as “BMW test drive” for an auto dealer website, though it may be easier to rank for.
Navigate to the Assisted Conversions report, (Conversions > Multi-Channel Funnels > Assisted Conversions). Here you can perform a month-on-month comparison of conversions via organic (or any traffic source) or in which organic played a role. The higher the contribution of organic search to your assisted conversions, the higher you can assume the quality of your organic search traffic is.

This figure should grow over time as your organic search presence grows, as your brand becomes established, as you earn repeat customers and as you improve the quality of the content on your website.
Understanding Your Bounce Rate
If a high volume of users are leaving your site as soon as they’ve arrived at it, the traffic you’re attracting may be of poor quality.
This could be due to the keywords that you’re targeting, some of which are searched by more relevant or primed web users than others. For example, the keyword “socks” is likely to produce less relevant traffic than “buy blue socks” is because it does not imply a specific user intent.
If poor keywords with weak intent aren’t the reason you have a high bounce rate, the issue may be that your web page needs improvement. Perhaps your loading times are too high, your web design is too weak or your messaging isn’t hitting the spot.
In Google Analytics, load the All Pages report (Behavior > Site Content > All Pages). Here you can see the bounce rate for specific pages of your website. By sorting these pages by bounce rate, you can easily identify key pages that are underperforming.

As you make changes to your site, check the change in bounce rate to see how your improvements have affected your customer’s first impressions.
Audience Reports
Google Analytics offers a range of useful reports about the people visiting your website under the Audience menu heading. Each is designed to help you to better understand your users, which can generate insights that prove useful to your SEO campaigns.
The Audience Overview report (Audience > Overview) is often one of the most popular reports for digital marketers. It provides many of the most important metrics in web marketing, such as:
- how many users visited your site
- how many of them were there for the first time
- how many pages they looked at
- how long they were on the site for
- what percentage of them immediately left your site
These statistics very quickly tell you how your marketing efforts in SEO and beyond are performing in terms of driving potential customers to your site and how well your site is serving those people.

There are many other useful reports under the Audience heading. For example, by looking at your Demographics and Interest reports, you may be able to come up with new ideas for content that your audience will enjoy or further develop your customer personas.
The Behavior report (Audience > Behaviour) will help you to understand how engaged with your content your audience is. For example, you can view your audience by categories such as New vs Returning user, Frequency & Recency, and their Engagement.
If content on your site is pulling in organic search traffic, but not performing well by these behaviour metrics, perhaps the content is not doing the job of guiding your users through your sales funnel. High volumes of returning users, on the other hand, suggests that once users have discovered your site in organic search, they’re being persuaded by your brand and want to interact with it again in the future.

By looking at the Geo report, you can find out how traffic from various locations is performing. If you notice that one city has a higher conversion rate than the others, you may have discovered an opportunity to create content targeting that location, for example.
Another example would be that you notice that one audience location generates a lot of traffic, but has a higher bounce rate – potentially a sign that you could benefit from publishing content in that location’s local language.
Looking at the Technology reports can also be useful for SEO. If you notice that a certain browser (for example, a mobile browser) has a much higher bounce rate than the others, you may have discovered an incompatibility that’s causing a bad user experience for certain users.

The Organic Visitor Segment
Google Analytics includes powerful segmentation options to allow you to view your data through the lens of just one type of user. Segments can be created based on a wide range of user variables, but thankfully, some of the most obvious and useful user segments are pre-configured for you.
One such pre-built segment is Organic Traffic. When working on your site’s SEO campaigns, use this segment to make sure the data you’re viewing refers only to traffic coming in via organic search.
Additionally, GA allows you to display and compare multiple segments at once. For example, you can display data for your paid search, paid social and organic search campaigns at the same time using segments for each. This can be very useful for understanding which channels convert best and therefore where you should invest further efforts.
Identifying SEO Opportunities With Google Analytics
One of the many benefits of having high-quality web traffic data at your disposal is that it allows you to identify easy opportunities to boost your traffic which would most likely have been missed without the data guiding you.
One example of how Google Analytics can help you to identify this low-hanging fruit can be found in the Landing Pages report.
Finding Pages That Could Benefit From Improvement
Go to Acquisition > All Traffic > Channels > Organic Search and expand the date range back into the past to ensure a good size sample of data. Select “compare to” and select the previous period.

Here you can see which pages have generated a reduced number of clicks, sessions and revenue, which is often a good starting point when looking for opportunities to update, expand or develop the content on your website.
Finding Highest Converting Landing Pages
Another Google Analytics Landing page report that’s helpful when working on your SEO is the Landing Page conversion rate report.
Navigate to Go to Acquisition > Search Console > Landing Pages, select your most valuable goal and sort the table by the conversion rate of that goal.

You now have a list of landing pages that drive the most conversions, a list that can be used to inform which URLs you focus on with your banklink generation campaigns as well as your paid traffic.
Finding What Your Users Are Looking For
Google Analytics has a feature called Site Search, which enables it to capture data on the queries users type into search bars on your website.
This can be incredibly useful for eCommerce stores, where you might discover the products and variants that customers want but you don’t currently stock. For content publishers, these search terms can be helpful suggestions for topics to cover in your articles.

Google’s guide to enabling Site Search can be found here.
Identifying Problems and Opportunities As Soon As They Occur
The whole idea of monitoring your website’s SEO health is to identify problems (and opportunities) before or as soon as they occur. Google Analytics allows you to set up email alerts which will be sent to you whenever the collected data fulfils a set of chosen criteria.
To set up an alert in GA, open Reports, navigate to Customisation > Custom Alerts > Manage Custom Alerts > New Alert.

From here, you can set up alerts for a range of business scenarios, but a couple of useful ones to get you started are alerts for days when no data is received by GA or when there is a dip or spike in traffic to your site.
When no data is received (i.e. a day passes without your Analytics script being triggered once), this can often be a sign of a problem with your website or tracking implementation. In other words, there’s a good chance your site could be down.
An alert for this would be configured as follows “all traffic -> Visits -> is less than -> 1”.
A sudden dip in traffic to your site could also signify an undiagnosed problem such as the site being down, an issue with a PPC campaign or a broken link somewhere on the web.
An alert for an unexpected drop in traffic would be configured as follows “all traffic -> Visits -> % decreases by more than -> 10% -> same day in the previous week”.
Conversely, alerts can make you aware of positive events also. You could enjoy a sudden spike in traffic thanks to a news story driving search demand, a new link from a popular domain or a recommendation from an influential social media user. An alert for a sudden spike in traffic will help to ensure that these opportunities don’t go unnoticed and set you up to capitalise on them as they happen.
An alert to notify you of a sudden spike in traffic would be configured as follows “all traffic -> Visits -> % increases by more than -> 10% -> same day in the previous week”.
Creating a General SEO Custom Dashboard
Now that you have Google Analytics set up correctly and have a solid idea of what data from GA is most useful to your business, it may be worth configuring a dashboard in Google Analytics to allow you to pull up these various metrics with a single click. Often, this improved presentation of the data is all that’s required to gain a clearer overview of the data, draw more useful insights and get more buy-in from stakeholders.
Google Analytics’ dashboarding tool is simple to use and mainly involves dragging the relevant widgets onto your dashboard. The dashboard will display the chosen metrics as easy to read graphs and the whole dashboard can be exported as a .pdf report to share beyond your team.
Common choices of metric to include are:
- All Organic Visits Over Time (Timeline)
- Top SEO Landing Pages
- Top Organic Keywords & % of New Visits
- Pages per Visit by Organic Keyword
- Most Successful Keywords by Goal Completions
There are also a range of user-generated templated dashboards designed for SEO that can be installed from Google’s free library.

Using Google Search Console to Inform Your SEO Campaigns
While Google Analytics can tell you about the activity that users perform on your website, Google Search Console allows you access to Google’s own data that they hold on your website.
In Google Search Console (GSC), you can find out how many times your website has appeared in Google search results, how many times those appearances were clicked on by users and discover opportunities to improve your site’s performance in those areas.
Two of the most useful tools in Google Search Console are the URL Inspection Tool and the Performance Report.
The URL Inspection Tool
The URL Inspection Tool provides information on the indexed and live versions of your web pages directly from Google’s index. This makes it one of the most useful tools in Google Search Console. If your pages are not appearing as expected in the search results, the GSC URL Inspection Tool should be your first port of call.
Navigate to Google Search Console and click on the URL Inspection Tool on the left hand menu. Paste in the URL you’d like to inspect, and you’ll be presented with all the indexation information from Googlebot’s last crawl of that web page. Although this date is usually relatively up-to-date, it’s important to understand that this is not live data, meaning changes made shortly before using the URL Inspection Tool will not be reflected immediately.
When the URL’s indexation information is returned, you may be informed that your URL is indexed in Google. Great! You may however be informed that your URL is indexed in Google, but has issues. This presents an opportunity to solve the issues and improve your websites compatibility with Google’s bots and indexation process. Typical issues include issues with the formatting of structured data on the page.

You’ll also be presented with some coverage information about the page, such as whether the page is included in your sitemap, when the page was last crawled by Googlebot and whether it was indexed or whether another canonical version was indexed in its place.
The URL Inspection page includes a button to “test live URL”.
When you click on this, Google will instantly test the current version of the chosen URL. This is useful for checking on the effects of changes you’ve made to your web pages without having to wait for the page to be indexed.
In the URL Inspection Tool, you can also select Request Indexing for a chosen URL. This is useful for when your live test has shown that your page updates have had the intended effect and you don’t want to wait for Googlebot to stumble across your page again before it notices your updates.
You can also view a URL’s information in the URL Inspection Tool by clicking on the small magnifying glass that appears next to URLs throughout Google Search Console.
The Performance Report
Another very useful tool in Google Search Console is the Performance report, which can also be found in the left-hand menu.
While the URL Inspection Tool offers insights into the compatibility of your website with Google’s crawlers and indexes, the Performance Tool offers accurate statistics about how many times those pages have appeared in the search engine and how many users have clicked on the link in those SERPs.
More specifically, the Performance report allows you to explore the key search performance metrics: impressions and clicks.

These metrics can be displayed for a series of dimensions, such as: Queries, pages, countries, devices, search appearance, and dates.
Finding Pages with Low Click-Through Rates
One typical example of an insight you may find in the Performance report is a page suffering from a low click-through rate. A low-click through rate indicates that a page’s content appears to be relevant to Google, is indexed in Google search and is being presented in the SERPs – but for some reason, users are not clicking on the link. As the only information the user has about the page is it’s title and meta data, a low-click through rate can often be solved by writing more relevant and enticing page titles and meta descriptions.
Simple fixes like this can generate higher click-through rates, which effectively equates to free traffic as you generate more website sessions from the same number of search impressions.
Identifying Missing Search Queries
In the Queries tab of the Performance report, you can view a list of all the search terms for which your domain has appeared in SERPs. If there are search terms that you’d expect or desire your website to appear for (such as your brand name of product category keyword respectively) which don’t appear here, it’s probably a sign that you’re going to need to undertake an SEO campaign to improve your visibility for those terms.
Spotting Missing Pages
In the pages listed on the Pages tab of the Performance report do not include all of the pages you’d like to see appearing in the SERPs, this could indicate a problem with those pages.

Pages missing from this list can be entered into the URL Inspection Tool where you may be able to find out why they have not been indexed or served.
Identifying Branded Search Queries
The Queries tab can also be useful in finding out what users are looking for in relation to your brand.
For example, if a marketer working for Samsung noticed queries for “Samsung phone case”, this might indicate that the company should launch cases to be sold alongside their phones.
Another example could be more focused around content. Searches for “Guardian protest news” would indicate to The Guardian’s search marketing team that their editorial staff should ensure they are covering news topics related to protests.
Filters can be used to view only those search queries that relate directly to your brand.
The Index Report
The Google Search Console Index Coverage report is another useful tool that can be found in the left-hand menu.
Coverage
The Coverage report lists all of the pages that Googlebot has discovered and indexed (or attempted to index) across your domain.
The Coverage report presents charts and tables representing the volume of pages with indexation errors, pages that are valid, but with warnings, valid pages and pages that were excluded from indexation.

The most important category is pages with errors. Pages with errors will not be indexed by Google, meaning they will never generate organic traffic to your website.
Typical errors include pages that are blocked in robots.txt, those that result in a soft 404 error, or pages that are otherwise affected by a server error.
Pages that are valid with warnings may, or may not appear in Google’s search results. It depends on the specific error. However, if a page appears in the valid with warnings category, it’s worth digging deeper to see which pages have warnings and why.
For example, your eCommerce website page may generate a warning because there is no SKU (Stock Keeping Unit, i.e. similar to a product code) implemented in the pages meta data, which might not be an issue if your product is unique and doesn’t have an SKU. This warning will not stop your page from being indexed and being served to your audience in the SERPs.
On the other hand, if the warning is that your eCommerce page is blocked by robots.txt, this warning may bring to light an unintentional block that will stop your page from being indexed and appearing in SERPs.
Google Search Console will email the account owner whenever a new coverage issue is detected. However, if an existing coverage issue gets worse, you won’t be notified. So while it’s not necessary to monitor the coverage report as closely as say, your Google Analytics reports, it’s worth checking in from time to time to ensure that no issues are developing in the background.
Sitemaps
Google Search Console provides a sitemaps report for your website. Although Googlebot is very good at discovering the pages of your site without a sitemap (through crawling), a sitemap can help to ensure no buried pages are missed, especially on sites that are very large, sites with isolated pages (no inbound links from other pages of the site), or if your site is regularly updated and you want Google to regnose changes more regularly than Googlebot crawls your site. Ultimately, all websites would benefit from having a sitemap implemented.
When you visit the Sitemaps report, you’ll notice that you can submit a new sitemap to GSC by simply pasting it’s URL and clicking submit.

In the Sitemaps report, you can see details of all of your site’s submitted sitemaps, including the siptemap’s location, type, submission date, when it was last updated, it’s status and the number of URLs found in the sitemap.
Clicking on the icon next to any successful sitemap will link you to the coverage report for that specific sitemap.
Please note that the Google Search Console Sitemaps report only provides information on sitemaps that have been submitted in Google Sitemaps and not sitemaps that were discovered via any other means (e.g. by Googlebot or via your robots.txt).
You can also remove a sitemap from Google Search Console, for example, if it’s out of date. While this will remove it from Google Search Console reports, it will not cause Google to forget your sitemap or deindex any pages. If you want Google to forget a sitemap entirely, simply remove it from your site. Google’s attempts to check the sitemap will then return a 404 error and eventually Google will forget the sitemap permanently.
The Links Report
The Links report is a combination of the “Links to your site” and “Internal Links” reports from the old Google Search Console.

Unsurprisingly, it provides information about the external and internal links on your website.
External Links
- Top linking sites = Which sites link to your website the most.
- Top linked pages = Which web pages have the most links pointing towards them
- Top linking text = The anchor texts are used most frequently to link towards your website.
Internal Links
- Top linked pages = Which pages have the most internal links pointing towards them.
The Mobile Usability Report
The final report that we will discuss is the Mobile Usability report which is increasingly important considering that Google have now moved to a mobile-first index.
The Mobile Usability report highlights pages that have usability problems when viewed on mobile devices.

The chart displays the number of pages that have errors as well as those that are valid.
Google also tells you exactly which errors are found on which pages at the bottom of the report.
Types of Errors
Below are the types of errors that you may come across:
- Uses incompatible plugins – This means that the page includes plugins, such as Flash, that are not supported by most mobile browsers. Google recommends redesigning these pages using web technologies that are supported by modern web browsers such as HTML5.
- Viewport not set – The viewport tells the web browser how to adjust the page’s dimension and so that it fits the user’s screen size. You should ensure that your pages specify a viewport using the meta viewport tag.
- Viewport not set to “device-width” – This means that the page defines a fixed-width viewport property which can’t be adjusted for different screen sizes.
- Content wider than screen – This means that the user has to scroll horizontally in order to see words and images on the page. Ensure that your pages use relative width and position values for CSS elements and that your images are scaled correctly.
- Text too small to read – The font size for the page is too small to be legible and would require mobile visitors to “pinch to zoom” in order to read.
- Clickable elements too close together – Touch elements, such as buttons and navigational links, are so close to each other that a mobile user cannot easily tap a desired element with their finger without also tapping a neighboring element.